Time: 18th od January 2016 at 16.00.
Lecture room: FAMNIT-1-MP2
Author: Vladimir Batagelj
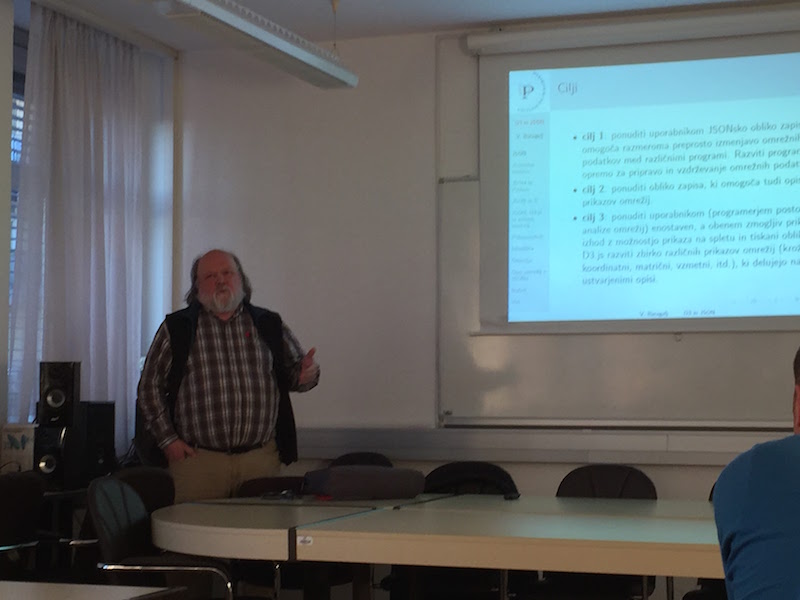
Title: Visualising networks with D3.js and JSON
POVZETEK:
D3.js (http://d3js.org/) is a JavaScript library that makes it easy to prepare interactive visualisations. It can also be used for displaying networks. The input data is usually in JSON format. I’m developing a new format called netJSON, which should allow for a description of the majority of networks
encountered in practice. I’m also developing the netD3 library, which offers a variety of network visualisations described in the form of netJSON, and visualise them in a web browser.
Visualisations can be exported as a SVG (Scalable Vector Graphics), edited with an SVG editor (Inkscape, Illustrator, etc.), exported in a selected format (EPS, PDF, PNG, etc.), and used in other types of publications (reports, slides, articles, etc.).
I will present the current version of the netJSON format, some visualisations from netD3 and plans for further refinements of both. Slodes and other materials will be available on http://vladowiki.fmf.uni-lj.si/doku.php?id=vis.
Welcome!
